Mini guide
Descriptive Statistics: summarise numbers in one go
Get the average, middle value, spread, smallest and largest for one or many columns at once. Example: test scores for three groups of 10 students.
Follow alongScores for Group A, B and C in A1:C11.
Fill in the form and press Run
- 1 Input range: A1:C11, all three groups with their headings. Type it, or select the cells and click the small grid button in the box. It shows as $A$1:$C$11.
- 2 Grouped by: Columns, because each group is a column.
- 3 Tick Labels in first row and Summary statistics. Leave the confidence level at 95.
- 4 Press Run. The results go on a new tab.
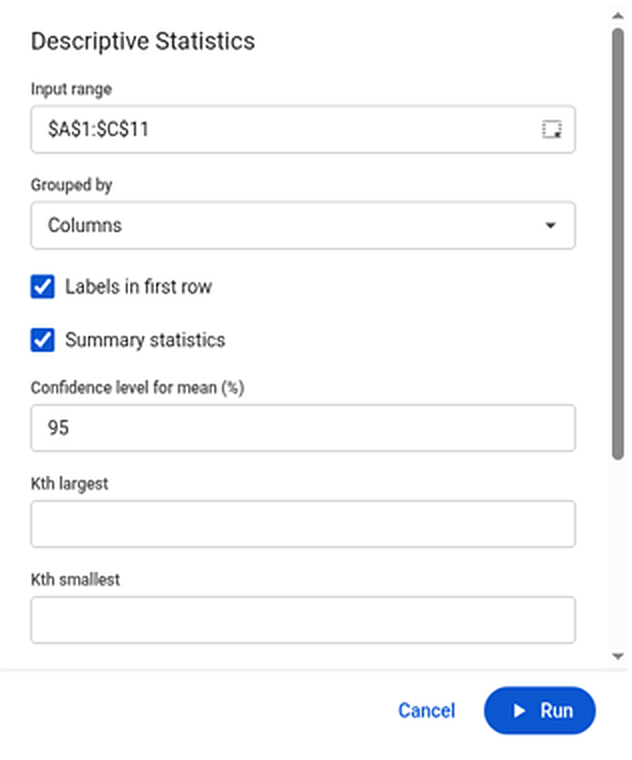
The Descriptive Statistics form, filled in.Enlarge Read the results
You get one block of two columns per group. What the main lines mean, using Group A:
Line Group A In plain English Mean 81.6 The average score. Median 81 The middle score when they're sorted. Mode #N/A The most common score. #N/A means no score appears twice. Standard Deviation 8.13 How far a typical score is from the average. Range 26 Highest minus lowest: 94 − 68. Count 10 How many scores there are. Confidence Level (95.0%) 5.81 The true average is very likely within 81.6 ± 5.81. Skewness, Kurtosis −0.08, −0.64 The shape of the spread. Close to 0 means fairly even on both sides. 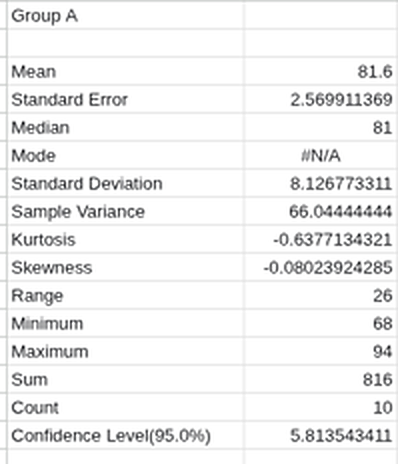
Group A's results. Groups B and C sit to the right, laid out the same way.Enlarge
Next: to check whether the groups really differ, try t-Test or Anova: Single Factor from the same list. All Data Analysis tools